pega6 curriculum framework
résumé-centric curriculum
We determined what skills, competencies, and experiences the ideal 2nd/3rd-year Product Builders had, and then we created a regiment of software builds designed to transform students into that employee over an intense 12-month period.
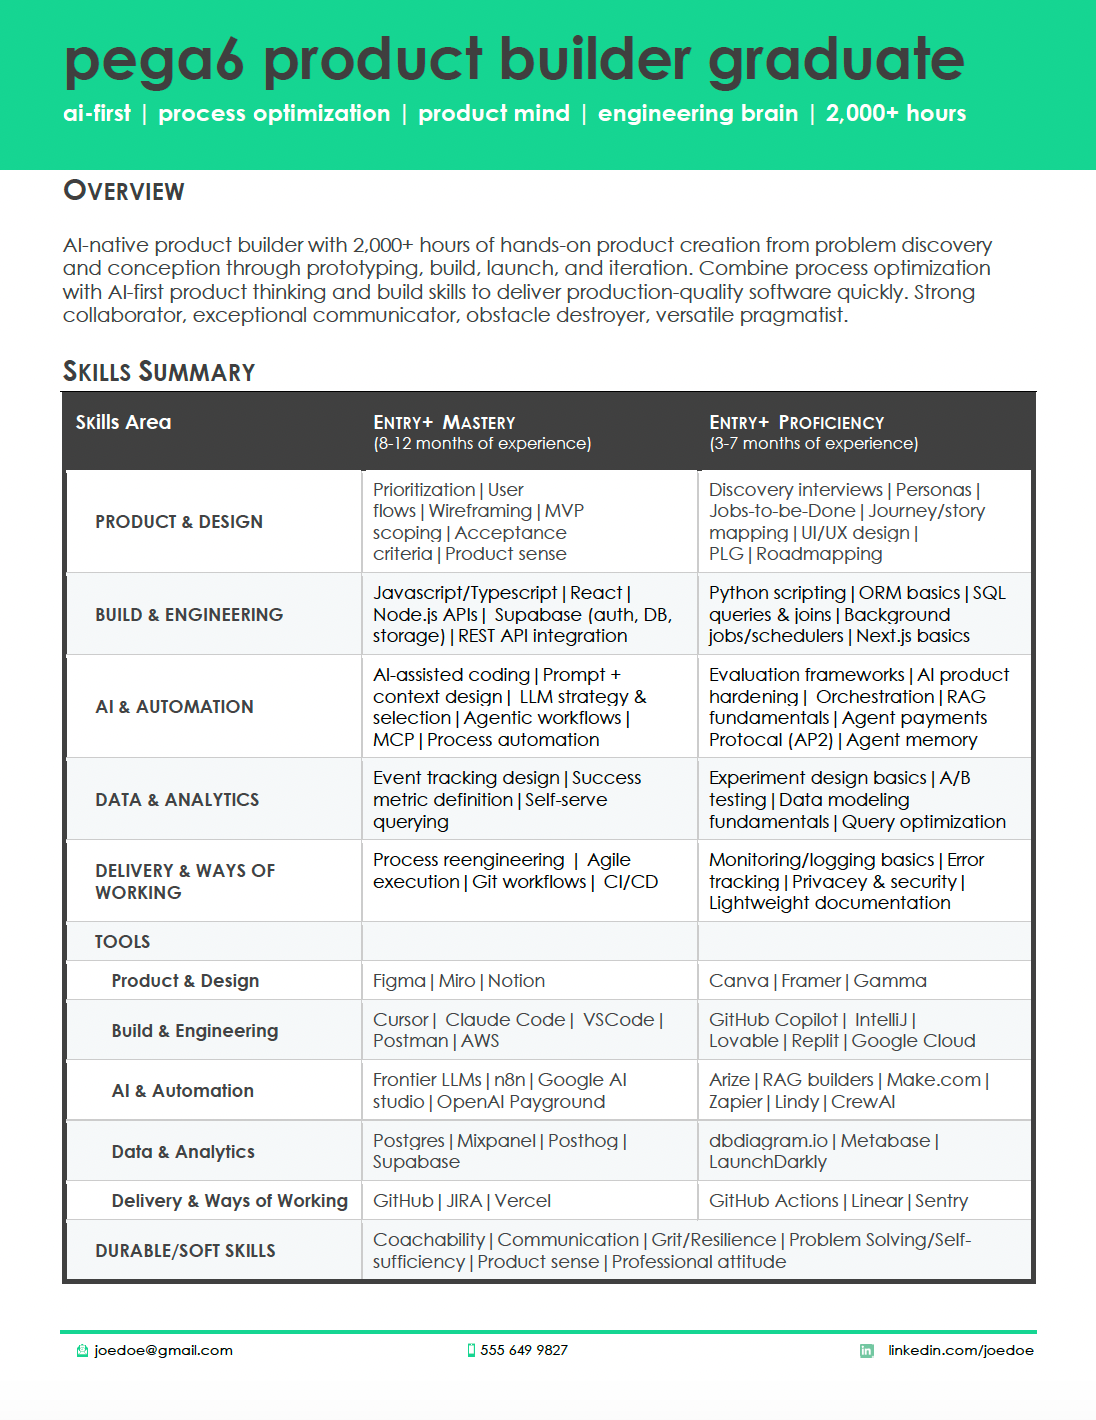
(page 1)
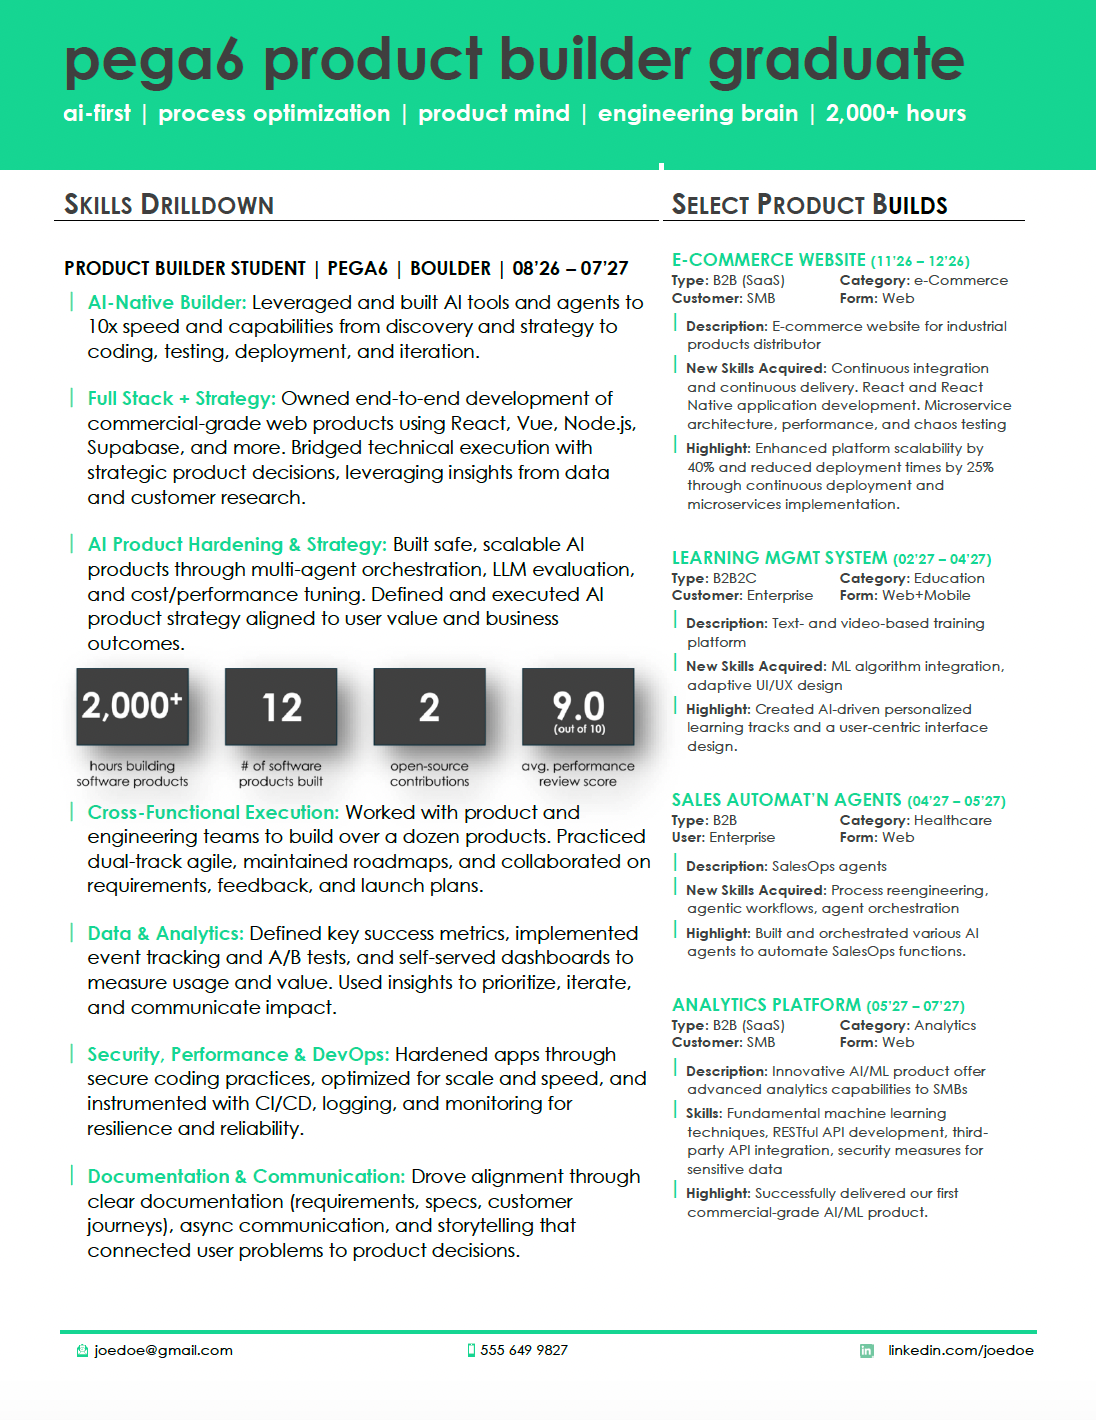
(page 2)
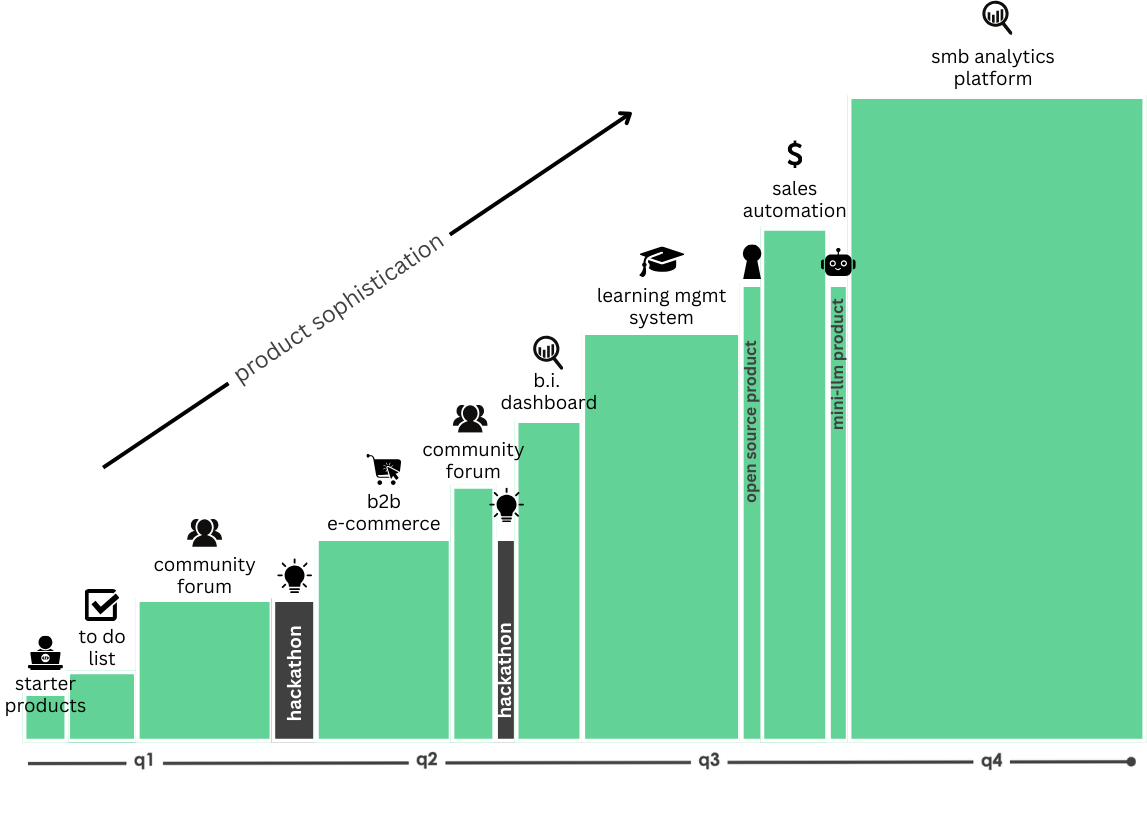
curriculum overview
our experiential curriculum is entirely comprised of software builds that provide the variety needed to achieve skills mastery and that increase in duration & sophistication during the year to continually challenge students
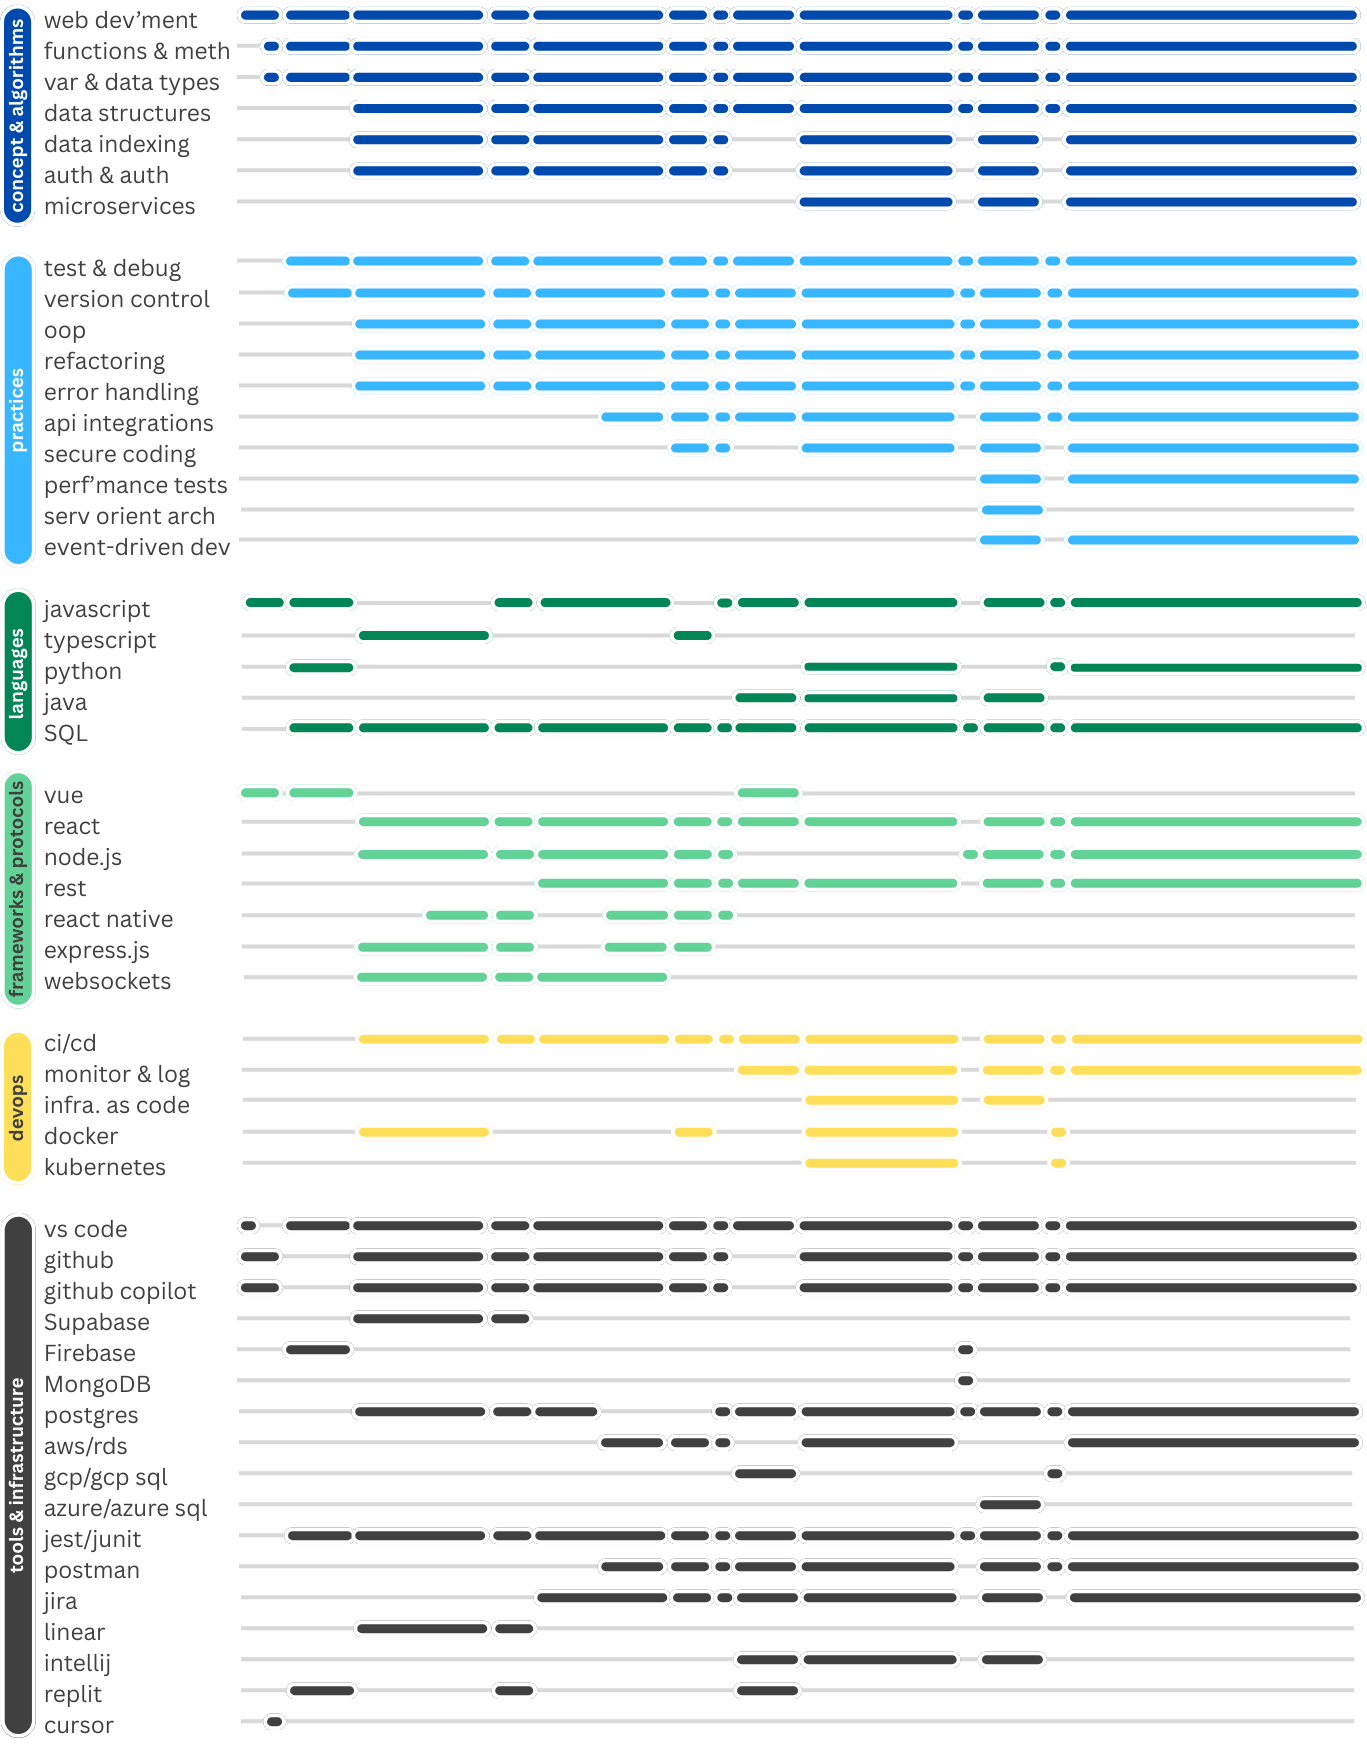
curriculum drilldown
software development skills
Each product build ensures that students use a prescribed set of dev skills and tools so they graduate as job-ready ai-natives from day one.

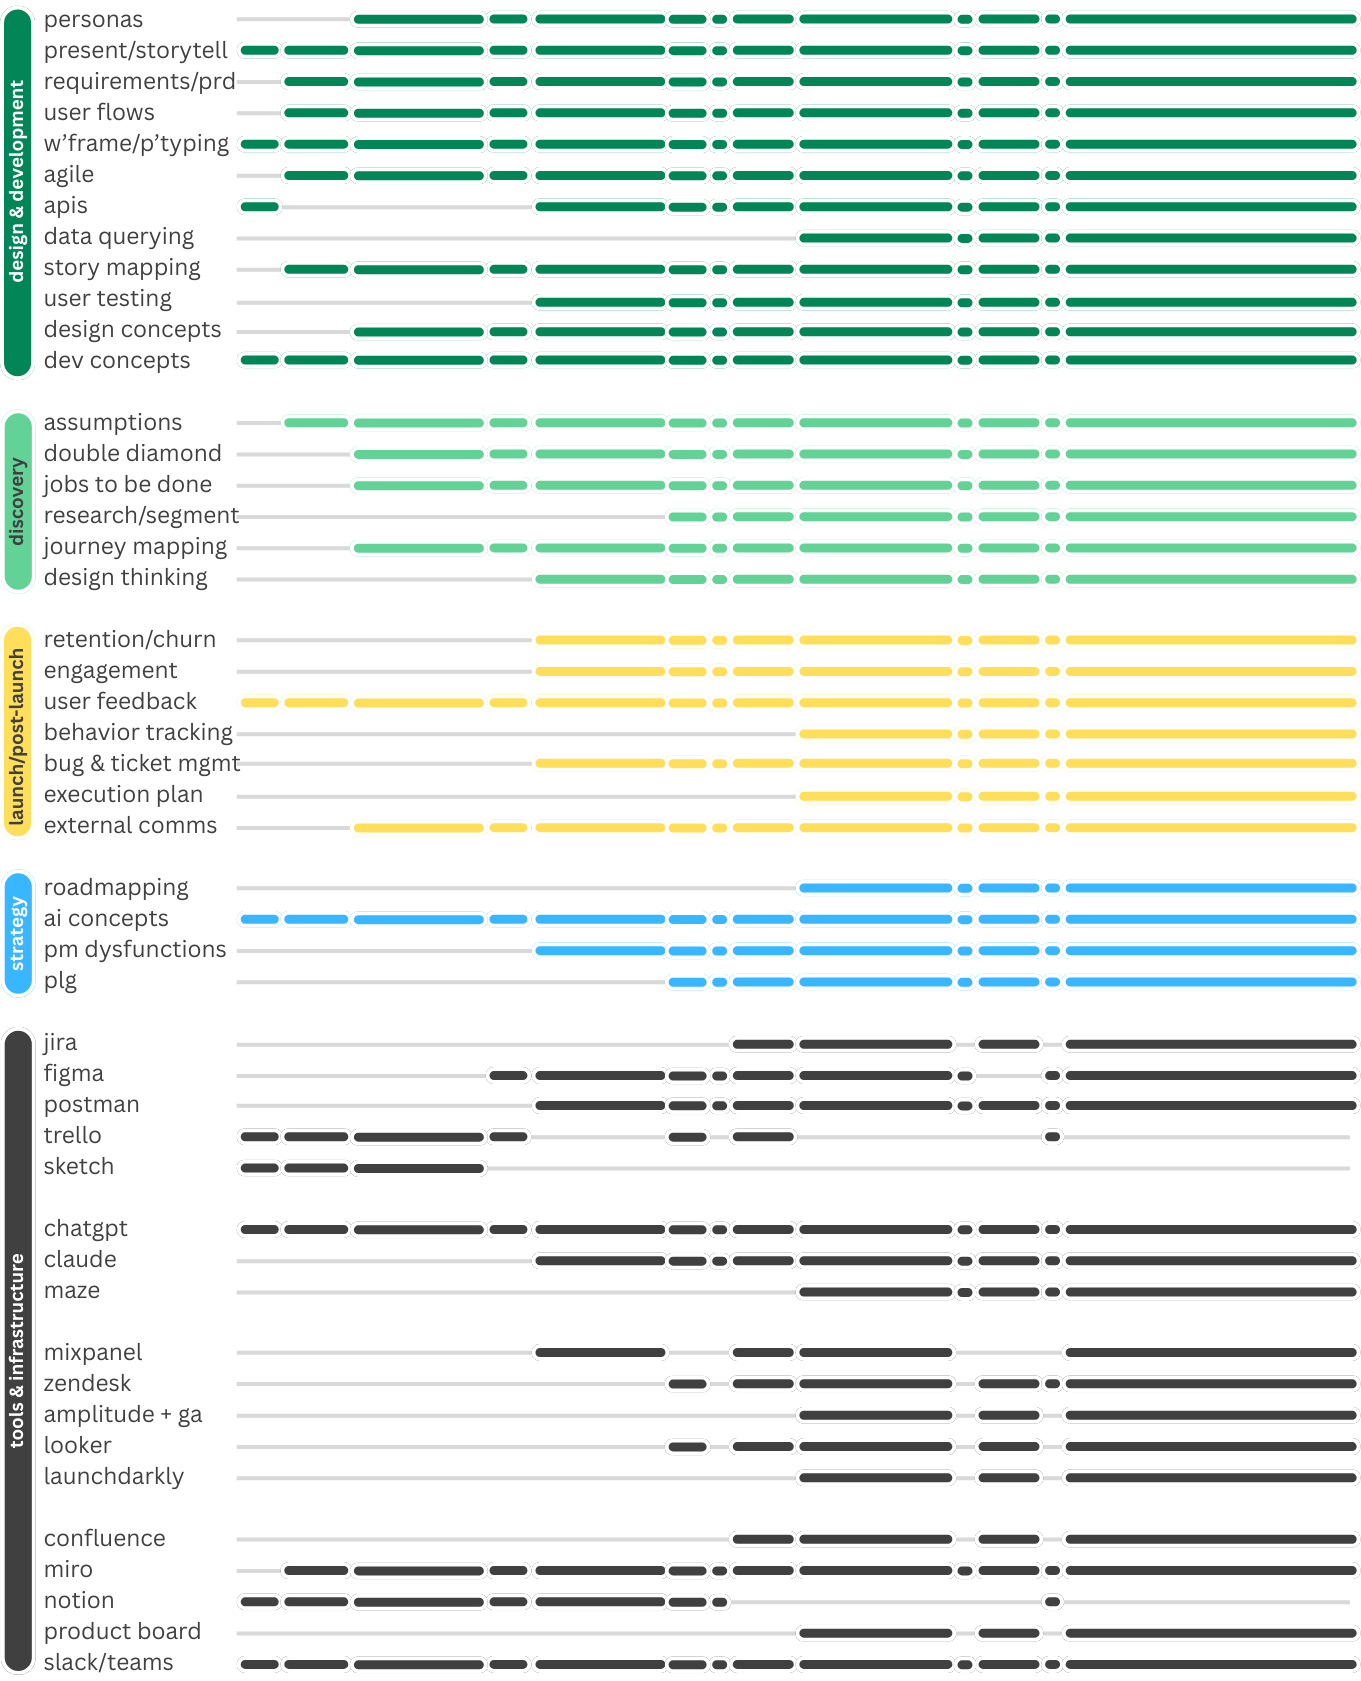
curriculum drilldown
product managment skills
Each product build ensures that pm students use a prescribed set of PM skills and tools so they graduate as job-ready ai-natives from day one.